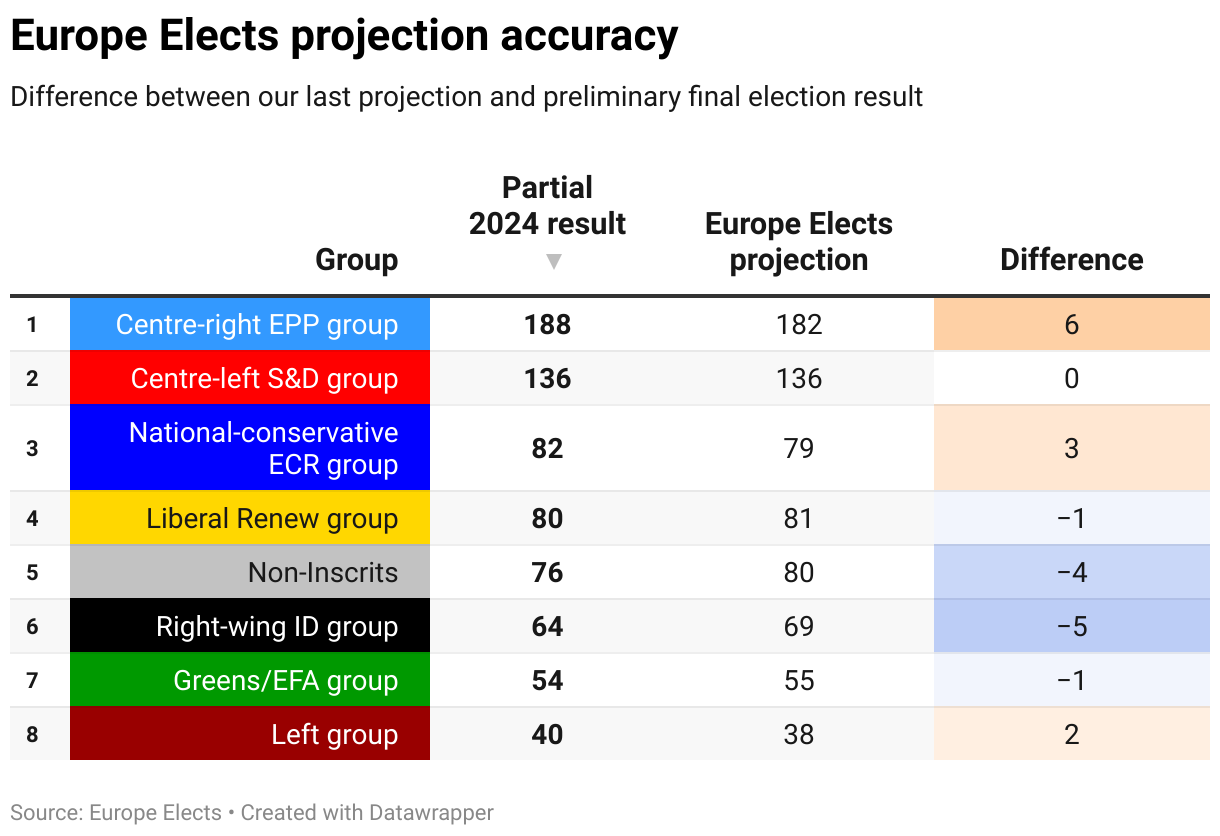
Election final results projection: EU level
Who has been winning in the different countries (timeline since first election)?

Turnout, eligible voters, and candidate stats
What's the data basis of the projection data?
Electoral law, Spitzenkandidaten & Europarties
Pre-election projection
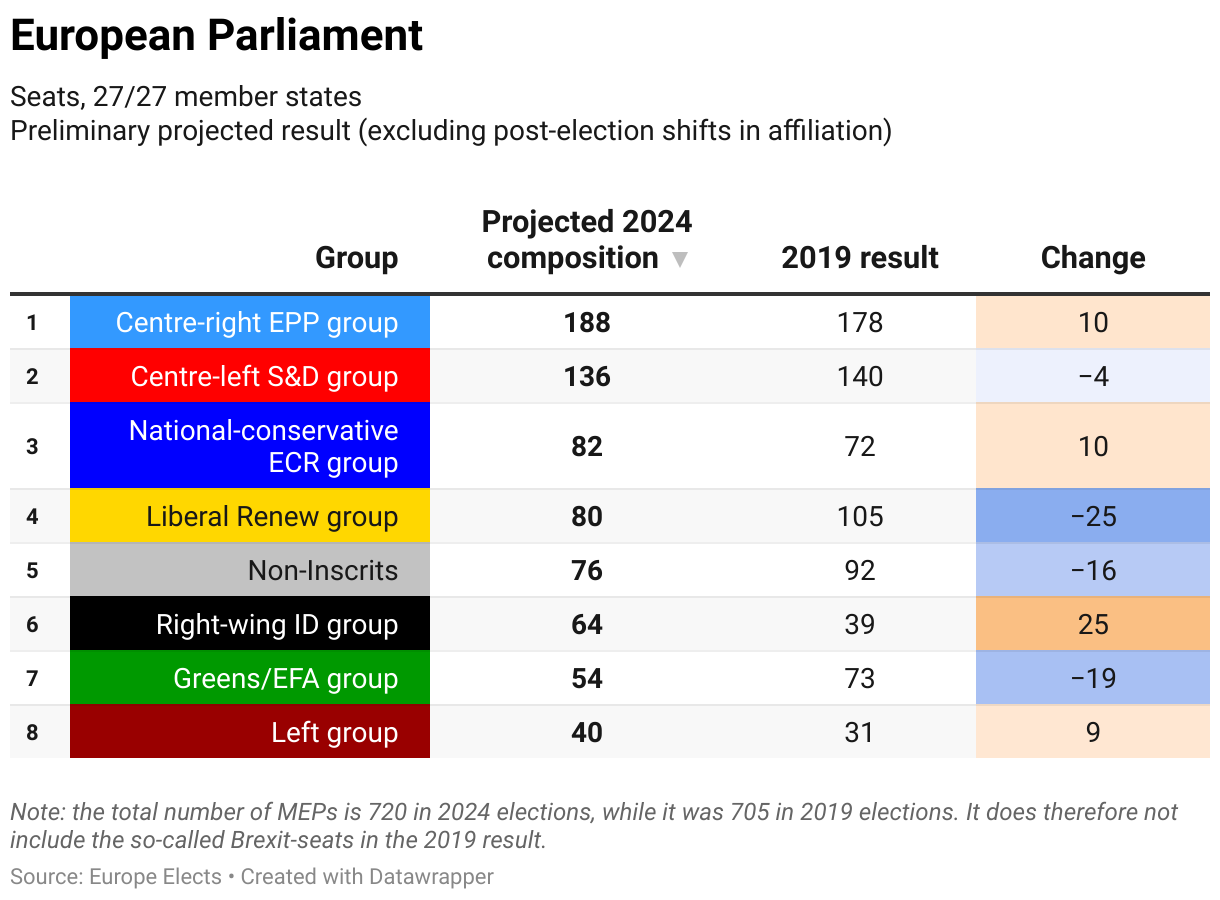
How do we expect the European Parliament to look like if an election was held today (30 May)?
How did the seat projection change between 2014 and 2019?
Methodology
In each constituency Europe Elects considers polls published with a sample size in the previous 90 days, using only the latest poll published by each firm. Polls asking directly about the European Election are preferred, but since those are rare and national polls are plentiful, the latter are often used. When no polls are available in the past 90 days, the latest available polling average figures or national or European parliament election result is used, whichever is more recent. Polls with a sample size of <501 are ignored. Europe Elects subject matter experts disregard or include certain pollsters based on external evidence (such as new paper articles) relating to credibility. In France, whenever no recent European Parliament polling is available, national parliamentary polls and Presidential polling serve as a proxy, depending on which one is more recent. If both were presented in the same month, national parliamentary polling will be used.
The constituency results are calculated probabilistically for each poll included in the projection using the correct local electoral law, a factor that is unique to the Europe Elects model, using weighted Monte Carlo simulations, essentially simulating the election many times over and over again to achieve the probability distribution of the results. The results for each constituency are combined by averaging the probability mass functions calculated for each poll.
These results are then combined into a single European result by convolving the probability mass functions of the parties in each European Parliament group, for example calculating for S&D the probability that PD from Italy will get x number of seats plus German SPD will get y seats plus Spanish PSOE will get z seats and so on for every party in S&D; the same is done for each group independently.
This method leaves us with separate bell curves each one of which we take the median result from as the predicted number of seats for the EU Parliament group. The sum of the medians will not add up to the total number of seats in the EU Parliament (25 March 2024: 720), one more step is required for that, but it will be close to it.
The reason for the medians not adding up to the total seats can be understood imagining 3 parties competing for a single seat in one constituency, each one having equal probability of winning. The probability mass function for each party will show it with a 1/3 probability of winning one seat and a 2/3 probability of netting 0 seats. The median result will therefore be 0 for all three, with a confidence interval of 0-1. The sum of the medians 0+0+0 = 0 not 1, yet the result is probabilistically correct.
The median result for each EP group is normalized to the total number of seats in the EU Parliament (25 March 2024: 720), making up for all the cases like the one described above by distributing the missing seats proportionally.
The grouping of the parties in the European Parliament is done by the team members of Europe Elects. Parties already represented in the European Parliament are kept in their current group. For new parties or parties that aren’t represented yet, we keep a close eye on (and often communicate with) relevant national parties to assess which group in the European Parliament they will join. We make our information transparent in the 'party' section on our website for each country. Hence, our projection is unique in that it aligns new parties with the existing families, rather than as an amorphous “new parties” group. In this context, it is important to differentiate between 'Non-Inscrits' and 'unaffiliated.' Non-Inscrits have made the explicit decision to not have a relationship with a group in the European Parliament. For example, they either sit as part of the Non-Inscrits or told Europe Elects that they would not join any group if elected. Parties labelled as 'unaffiliated' never made such a statement. There is no indication of which group they would join in the EU Parliament if elected, if any.
In some countries party coalitions are polled, which include parties from different European Parliament groups, for example, Sumar in Spain or PP-DB in Bulgaria. If no electoral lists for these groups are published yet, polling results are distributed between the member parties based on the ratio of their national MPs. If this is not available, the last polling average before the forming of the coalition is used as a basis of distribution. As soon as the electoral lists are available, the distribution of seats is based on them. Unless public polling is available, we cannot account for open-list effects.
For German minor parties, Europe Elects uses the trajectory of the parties during the EU legislative period (the time between two EU elections) in regional and national parliament elections when no polling is available. First, the mean trend of the party in each regional parliament election is calculated. If a party does not participate in the pre-EU election and post-EU election, the value is set as a 0. Let's assume a party won 1% in 15 regional elections in 2017. In 2021, it won 2% in 14 regional elections. It did not contest the election in the 15th region. The trajectory would be +1 for each of the 14 regions (=+14), it would be -1 for the 15th region and 0 for the 16th region (Germany has 16 regions, the example party here did not contest there in 2017 or 2021, so the value is 0. The figure is then divided by 16, which in this case would produce +14-1+0=13 -> 13/16-> +.81. Second, the trend of the party during the national parliament election in an EU legislative period is relevant. Let's assume that our example party gains +.21 points in the 2021 national parliament election compared to the 2017 national parliament election (from one EU legislative period to the next). The +.81 (regional election mean trend) and +.21 (national election trend) are added and divided by 2. This is then added to the latest EU parliament election result of the party. Let's assume the example party won 2% in the 2019 EU election, it would now be projected to win (.81+.21)/2=+.51 => 2%+.51=> 2.51%. If a party did not run in the 2019 election, its 2019 EU election value is considered 0%. This is repeated for each minor party. All minor parties are then added to each other. Then the polling average is taken into consideration. The sum of minor parties is scaled to the (EU or national) polling average. Let's assume that "others" are polling at 6% and the sum of minor parties was projected to be 12.23%, then the result of our example party is scaled from 2.51% / 12.23 * 6 to 1.23%. When a party is projected a negative value, it is adjusted manually to 0 and the adjustment is repeated with the remaining minor parties.
Note: Europe Elects does not conduct interviews for polling. Europe Elects's projections do not forecast, but nowcast (European Central Bank, 2013, p. 2), EU election results.