Amid a long-running and expanding political crisis that has divided their country, Georgians went to the polls this month to elect municipal councils and mayoral offices nationwide.
For more than a year, the Caucasian republic has seen widespread protests following parliamentary elections that the opposition has alleged were rigged in favour of the incumbent Georgian Dream (GD~NI) party. These allegations have been supported by independent reports of “carousel voting” (busing of voters to cast multiple ballots), violations of voter secrecy, statistically inexplicable exit poll outliers, and irregular voting patterns.
Consequently, two opposition alliances – centre-right Unity (U/NM-EPP|RE) and liberal Coalition for Change (CfC-RE) – announced a full boycott ahead of this year’s local elections. They received 36% of the vote in the 2021 local elections and 22% in last year’s parliamentary vote.
However, opposition parties were not united in pursuing a boycott. Two centrist opposition lists, Strong Georgia (SG-RE) and For Georgia (ForGeo~ EPP), which had received a combined 11% in 2021 and 16% in 2024, did not join.
Instead, ForGeo fielded candidates in every municipality while SG ran in all but one. Despite their efforts, the two lists ultimately yielded a total result of just 10%. And while turnout fell to just 41%, significantly lower than in 2021 (52%) and 2024 (60%), GD saw its vote share increase from 47% (2021), respectively 54% (2024), to 82% in 2025. Such an extreme increase has raised doubts over the integrity of the results.
According to forensic electoral analysis conducted by Europe Elects, such doubts are not unfounded.
Based on a multi-methodological analysis of the official proportional vote data from over 3,000 precincts reported by the Georgian Central Electoral Commission, Europe Elects found that the results show serious signs of falsification and vote tampering, even while accounting for the specific peculiarities of this election.
Normal Distribution Deviations
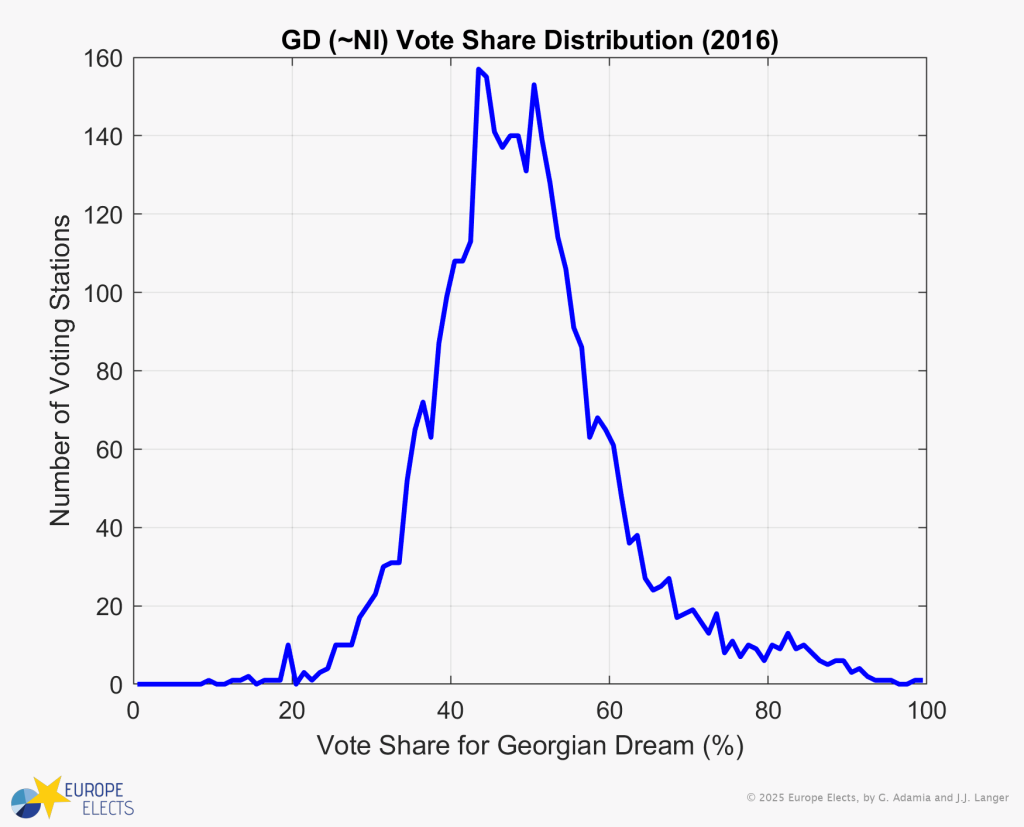
Under normal conditions, a party’s precinct-level electoral results should roughly follow a normal, bell-shaped distribution. Usually, a party’s support is unimodal: there is a single highest value, and then higher and lower party results fall on either side of it, though depending on the total number of voting stations, this distribution may still be somewhat “spikey”.
In other words, under normal circumstances, a party will usually get somewhere close to its average result in most precincts with fewer and fewer precincts reporting results further from that average in either direction.
GD’s 2016 parliamentary election results followed this bell-curve pattern, even when accounting for differences between rural and urban voting stations. In that election, GD received 49% of the national proportional vote. As a result, the vast majority of polling locations reported local GD vote percentages somewhere between 40 and 50 %. Some locations saw the party do much better or much worse than that range, but the end result reflected the national average.
Figure 1: Vote share distribution for GD in the 2016 parliamentary election.
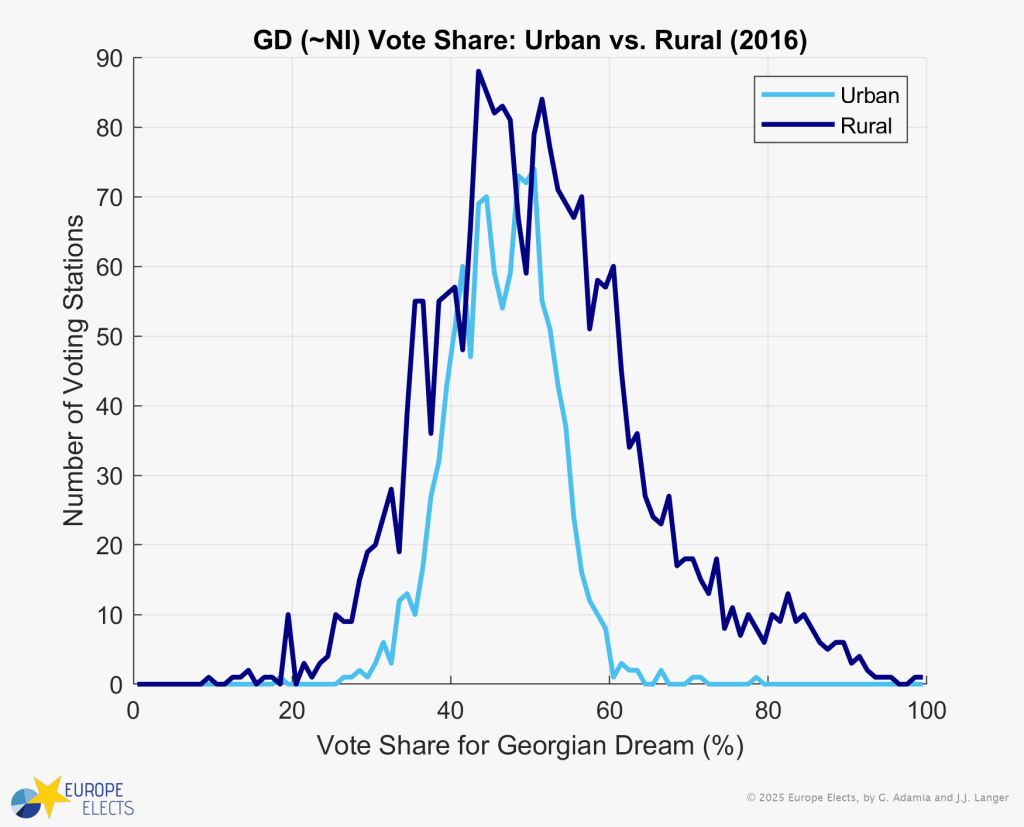
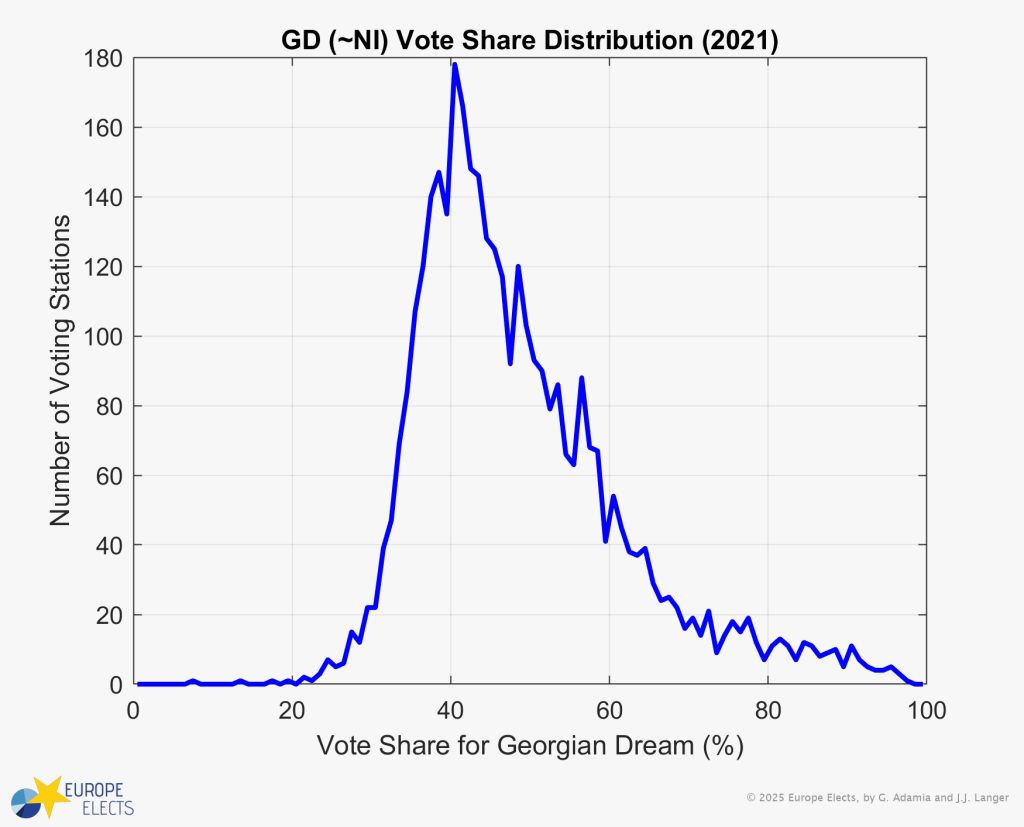
In the 2021 local elections, however, the distribution of vote shares became less predictable. While still a bell-curve, GD’s results developed a “tail” at the higher vote-share end.
Normally, the number of precincts with an above-average GD vote share should decrease in tandem with below-average results. In urban precincts, which had a median GD vote share of 40%, this was indeed the case, with results of virtually all polling places clustered within a range of 30–50%. In rural precincts, where the peak was at 50%, almost no precincts showed <25% support for GD, while a not insignificant number of precincts reported GD winning >75% of the votes cast – visible as a tail.
While this could have been a consequence of various factors, such a phenomenon marks a non-random process that might indicate vote tampering. This behaviour has previously been observed at an extreme level during manipulated elections in Russia, and is thus often referred to as a “Russian tail”.
Figure 2: Vote share distribution for GD in the 2021 local elections.
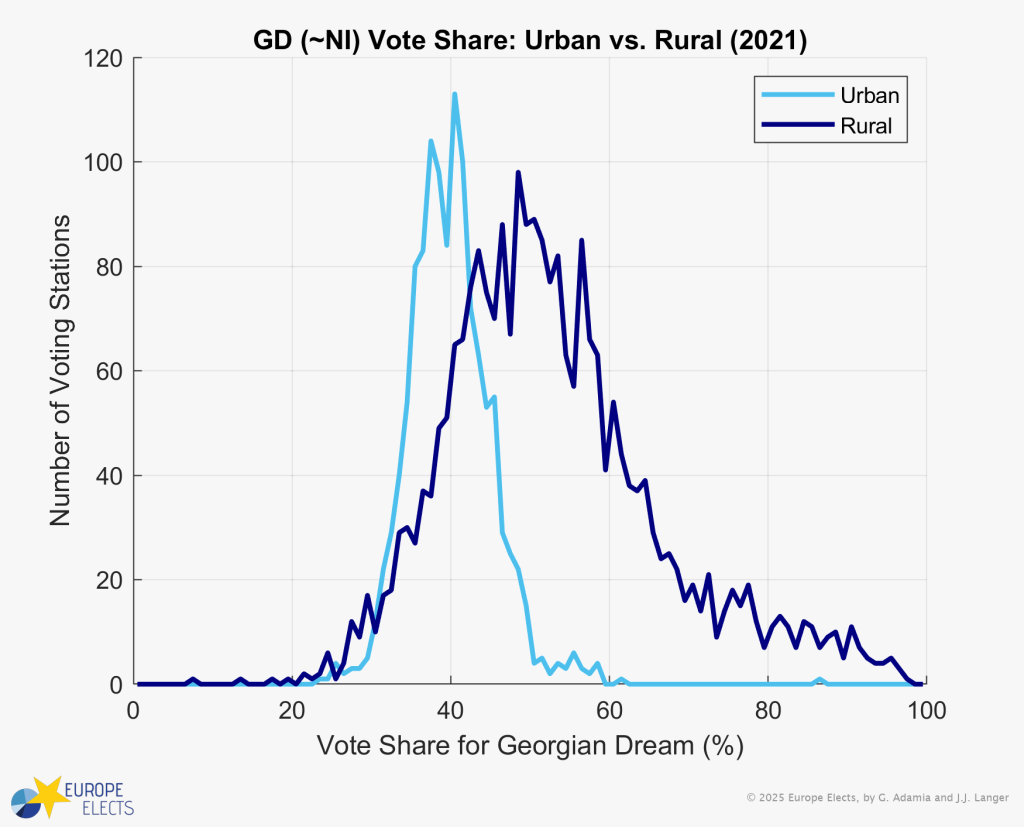
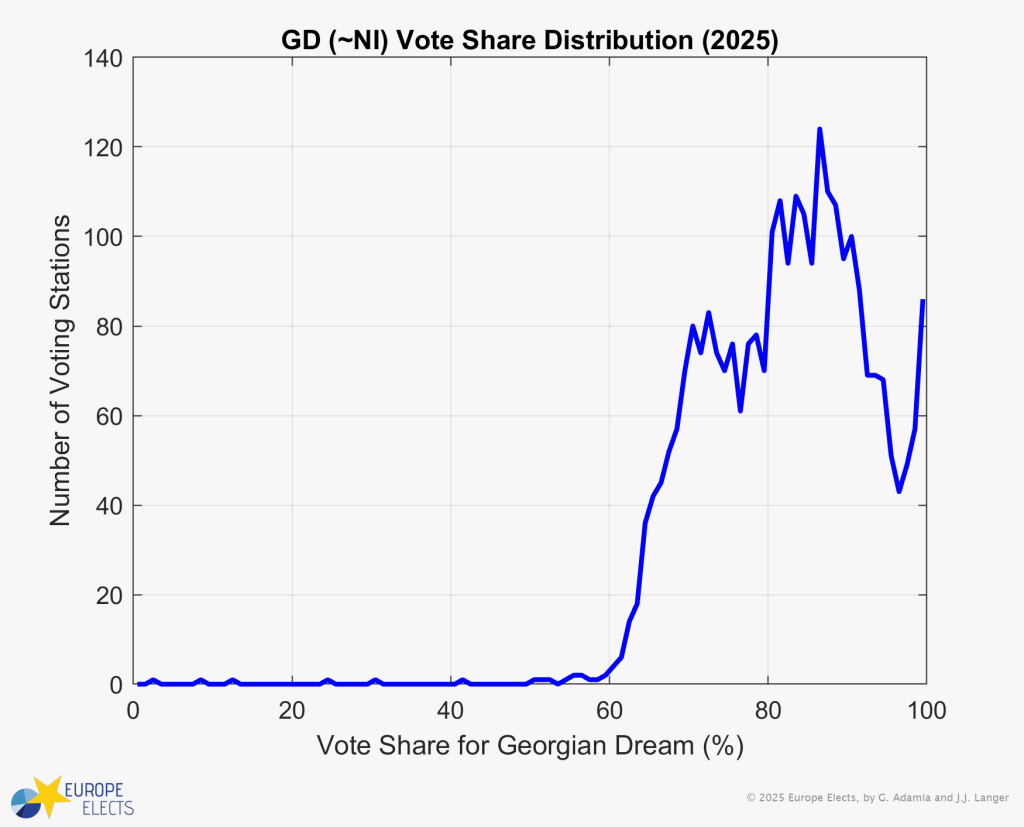
This year’s election results, however, deviated significantly — even from the tail identified in the 2021 data.
In urban precincts, GD’s vote share still followed a normal distribution, albeit with a noticeable tail. Yet, in rural stations, the party allegedly saw a massive uptick at the higher end of the vote distribution chart, indicating a large number of precincts where GD received more than 95% of the vote.
These precincts account for almost 11% of the analysed ~3,000 voting stations, and more than 130,000 out of the 1.1 million ballots cast for GD. While the partial opposition boycott and GD’s greater popularity in rural areas may partially explain the distinct curves, the abnormally high number of precincts reporting a near 100% remains suspicious – especially given that a) this behaviour occurred across multiple municipalities, and that b) at least 2 other parties actively competed against GD in every single municipality.
Figure 3: Vote share distribution for GD in the 2025 local elections.
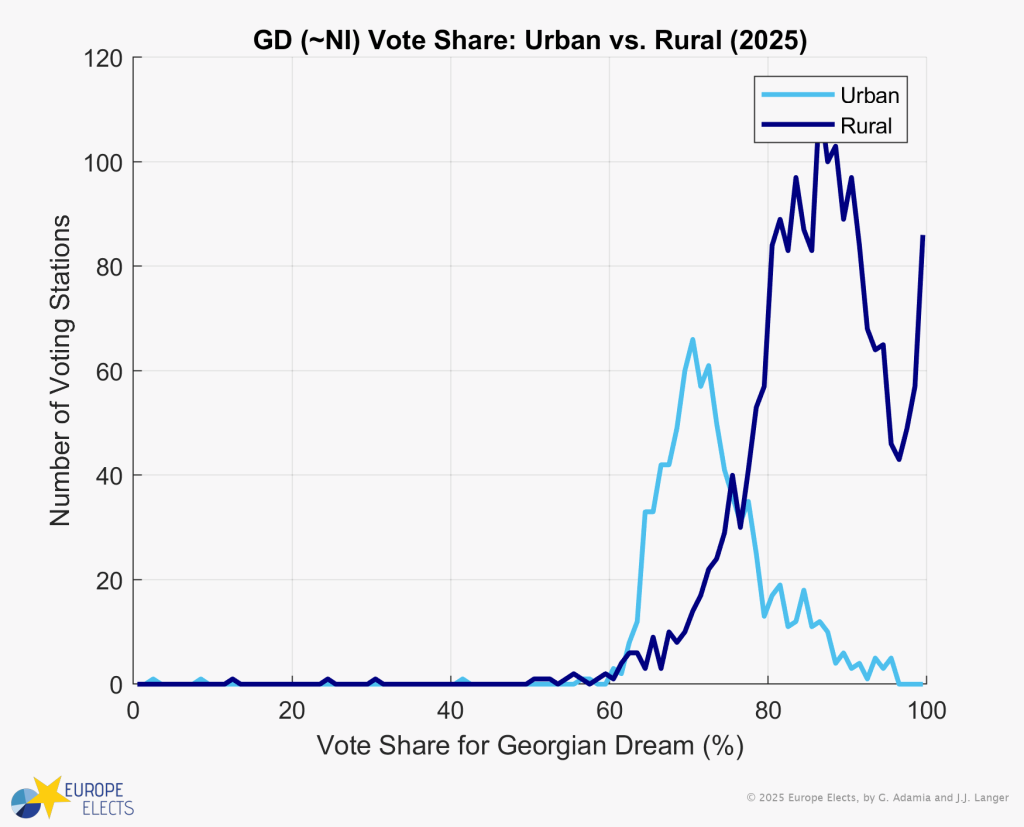
Deviations from the Boycott Voting Patterns on the Municipality Level
While on the face of it, the existence of a nationwide election boycott could have complicated these results, this cannot explain such an extreme distribution. Boycotts follow a certain pattern, and there are Georgian precedents with which the 2025 results can be contrasted.
The most recent example of a large-scale boycott was the 2016 parliamentary election, where the centre-right UN/M (EPP) – now a part of the Unity alliance – de facto boycotted the runoffs for majoritarian seats (the party vowed to run, but UNM’s influential founder Mikheil Saakashvili called for a full boycott, which most UNM supporters adhered to).
From the first to the second round, GD’s vote share increased from 47% to 70%, while turnout fell from 52% to 37%. And where GD had performed the worst during the first round, the turnout declined the sharpest, indicating that anti-GD voters stayed home, thus reducing the total vote numbers while increasing that party’s share of the votes cast.
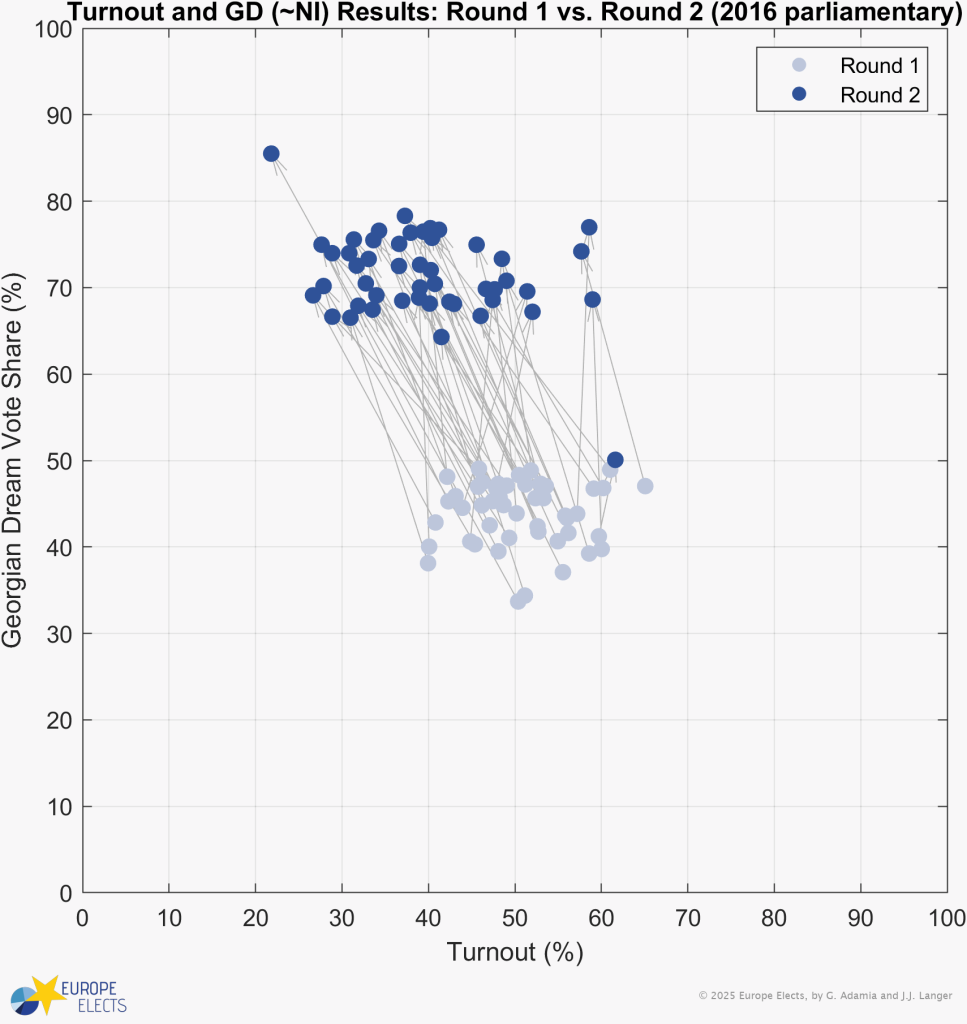
This “boycott shift” should also have been observed in this year’s election. In fact, the country’s urban centres (Tbilisi’s 10 districts, Batumi, Rustavi, Kutaisi, Poti, and Zugdidi) did experience such a shift.
In those municipalities, turnout decreased by up to 26 percentage points from 2021, compared to an 11 percentage point drop nationwide. As a result, GD saw its vote share rise from 40% in urban districts to 74% this year.
Coincidentally, urban precincts tend to be less prone to electoral violations as they usually have a more developed observer network and a lower likelihood of governmental pressure. For example, while just 25% of Georgians are employed in the public sector, that number is significantly higher in rural than in urban areas.
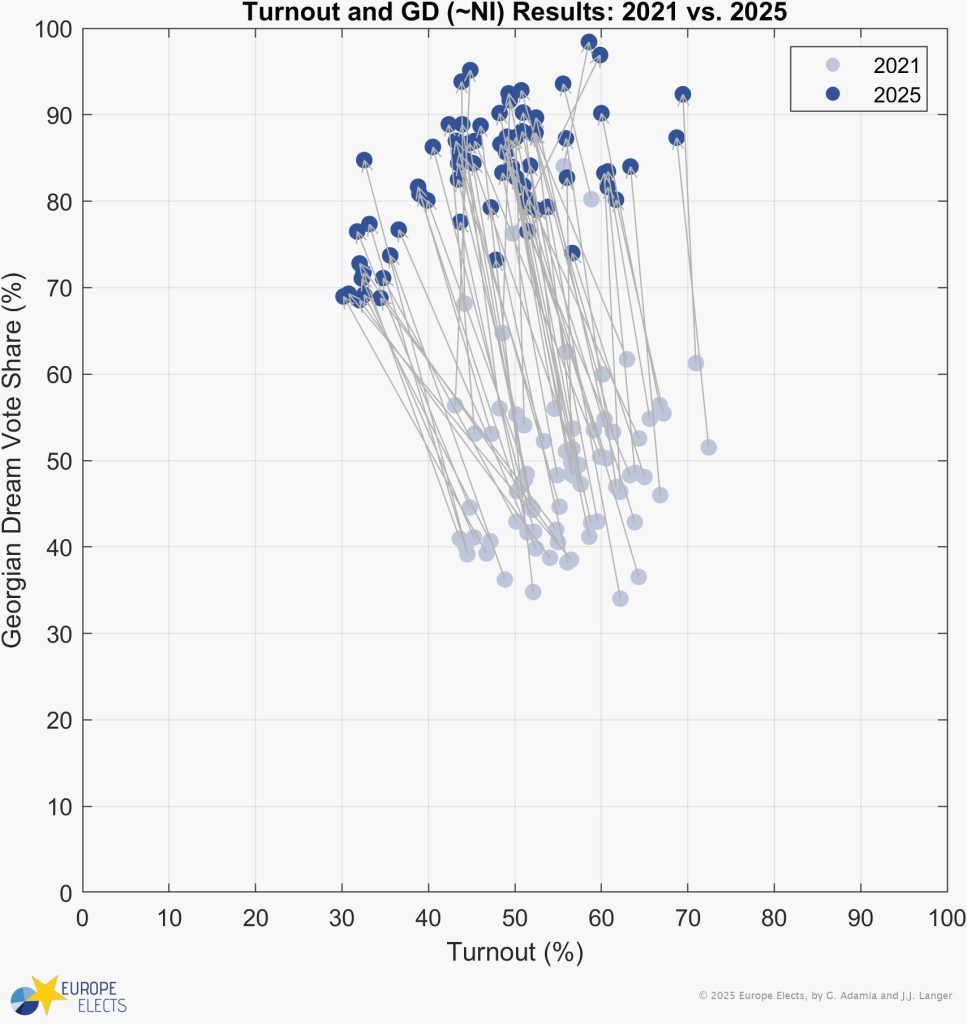
In contrast to urban precincts in this election, turnout across rural municipalities fell by an abnormally low amount, while GD’s vote share increased disproportionately. In the seaside resort district of Kobuleti, for instance, GD almost doubled its vote share from 48% to 90%, while voter participation fell by only 9 percentage points. While this in itself is not a direct proof of vote tampering, the absence of the expected boycott shift can be an indication of electoral irregularities such as carousel voting or the exercise of governmental pressure on the electorate.
Sobyanin-Sukhovolsky Analysis
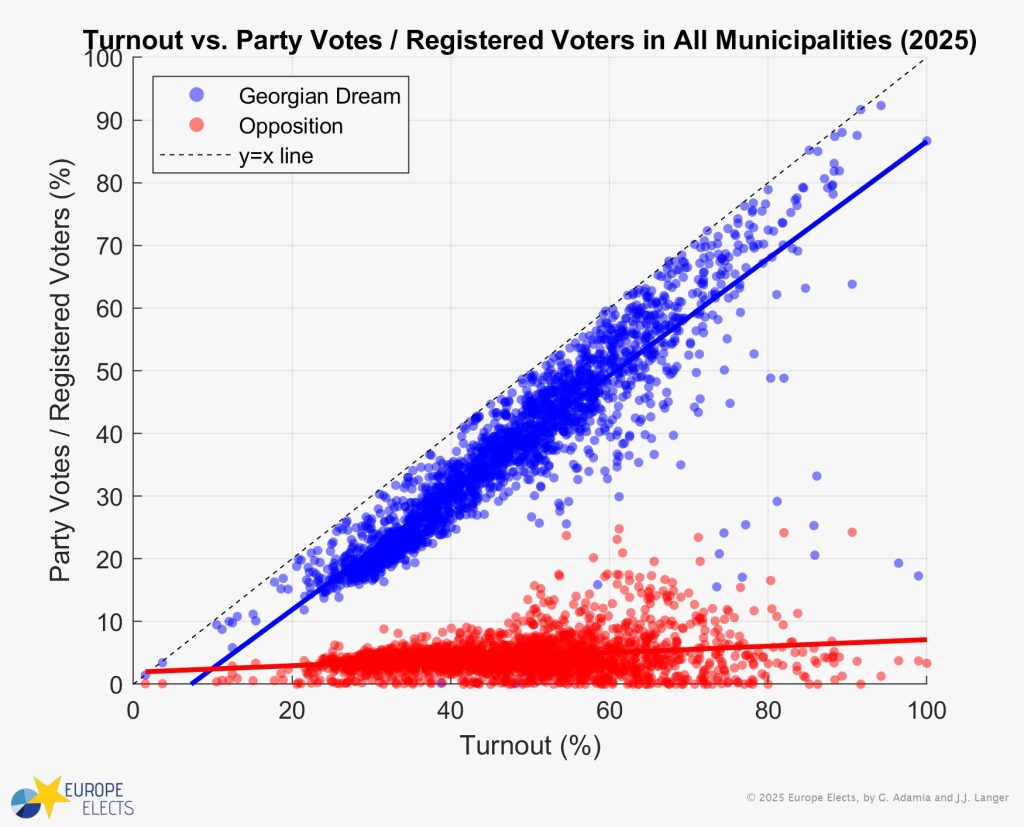
A common method for analysing electoral anomalies is to plot party results as a function of turnout, known as a Sobyanin-Sukhovolsky Analysis.
In a fully legitimate election, a linear regression line passing through these data points should have a modest slope — the proportion of votes a party receives should increase gently as turnout increases, with all competitors benefiting somewhat. In the 2021 local elections, this was the case for both GD and the combined opposition vote.
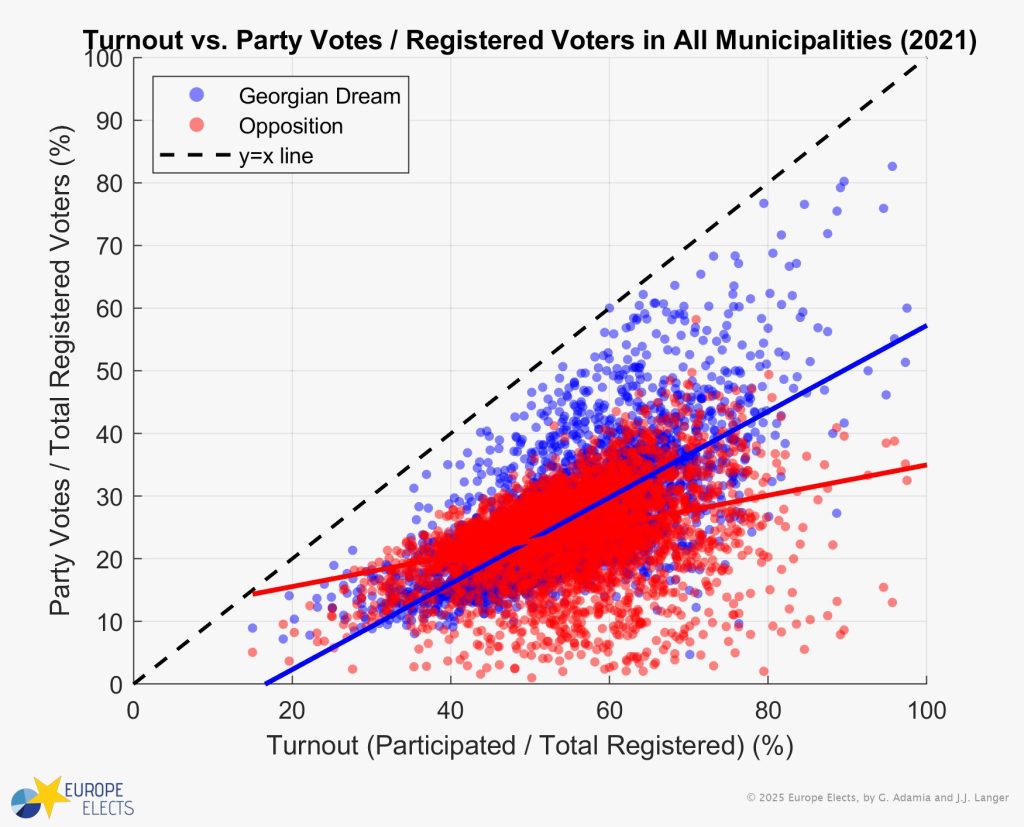
Yet, in this year’s election, the linear regression for GD’s vote share runs almost parallel to the party vote — turnout line, while the slope for the combined opposition vote is near 0.
This means that as turnout increases, nearly all votes go to GD, while the opposition does not benefit from higher turnout. Such trends are classically a sign of ballot stuffing or carousel voting.
Comet Tail Analysis and Precinct Fingerprint
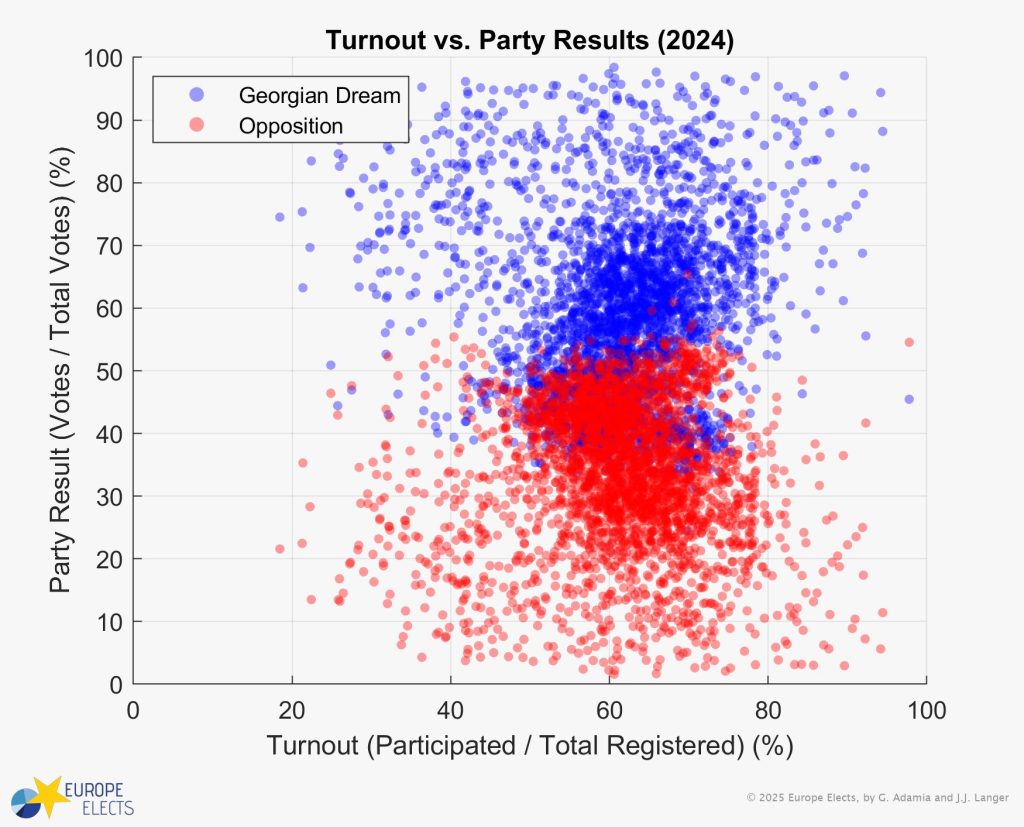
In a normal election, the party vote share plotted against turnout typically produces a spherical cloud, as essentially the bell curve on the x-axis and y-axis intersect at a right angle in two dimensions. Both the 2016 parliamentary and the 2021 local elections resulted in a uniform cluster around the median result for GD and the opposition, both vote share and turnout-wise (2016: 48% GD and 37% opposition at 52% turnout; 2021: 47% GD and 47% opposition at 52% turnout):
Figure 8: Comet Tail Analysis for 2016 (parliamentary election) and 2021 (local elections).
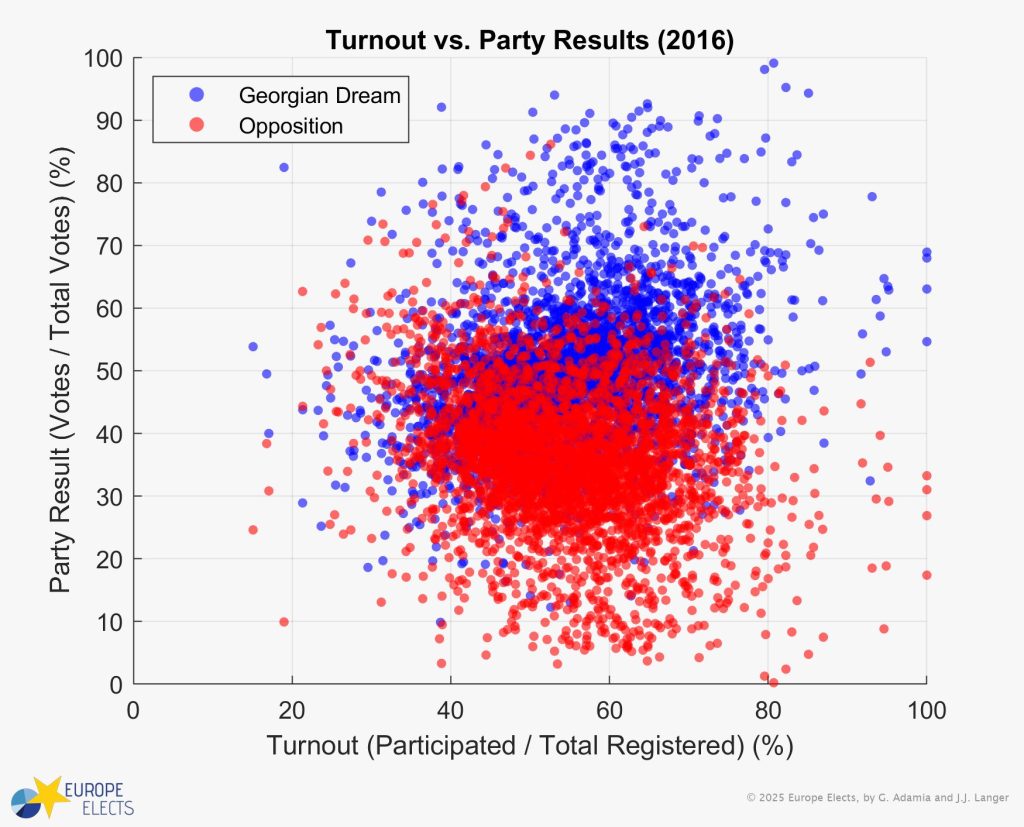
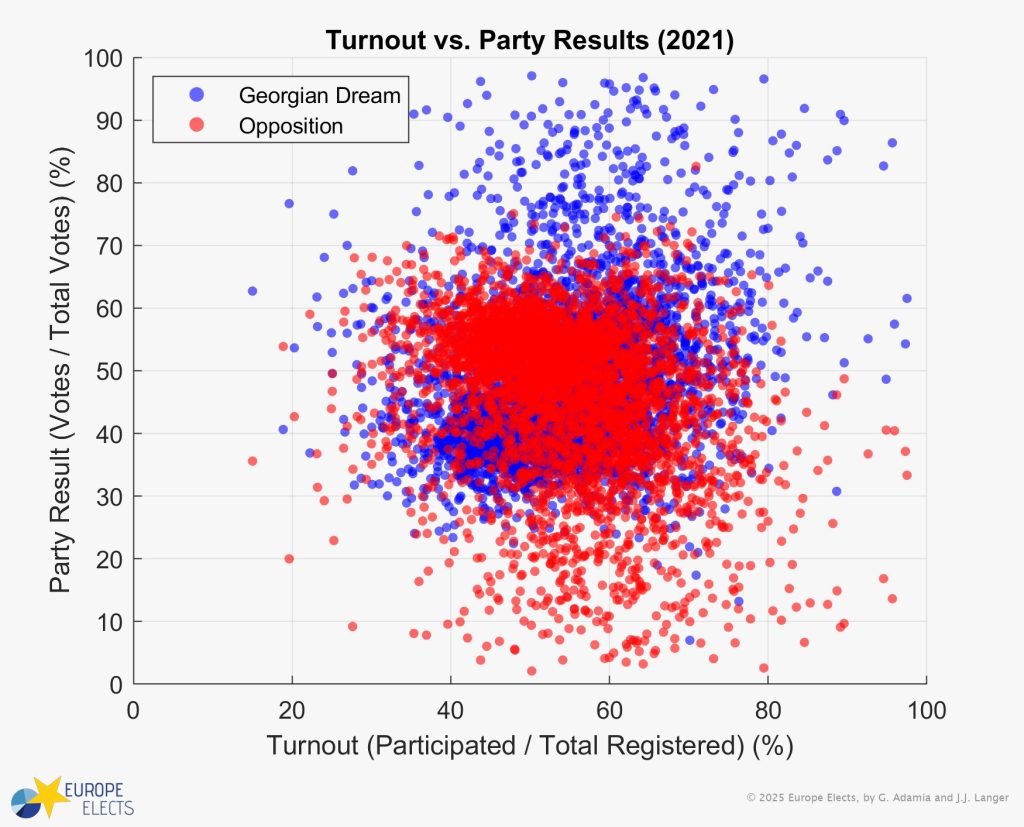
In the 2024 parliamentary election, on the other hand, the GD and opposition vote share started diverging from this pattern. Above the median GD result cloud, there is a “comet tail” of precincts with both a disturbingly high turnout and GD vote share. Combined, these factors often point to electoral interference, such as carousel voting or voter intimidation.
In this year’s election, the “comet tail” was even more extreme. Instead of a spherical cloud for the GD result, there is a more elliptical spread, with GD results strongly improving as turnout increases.
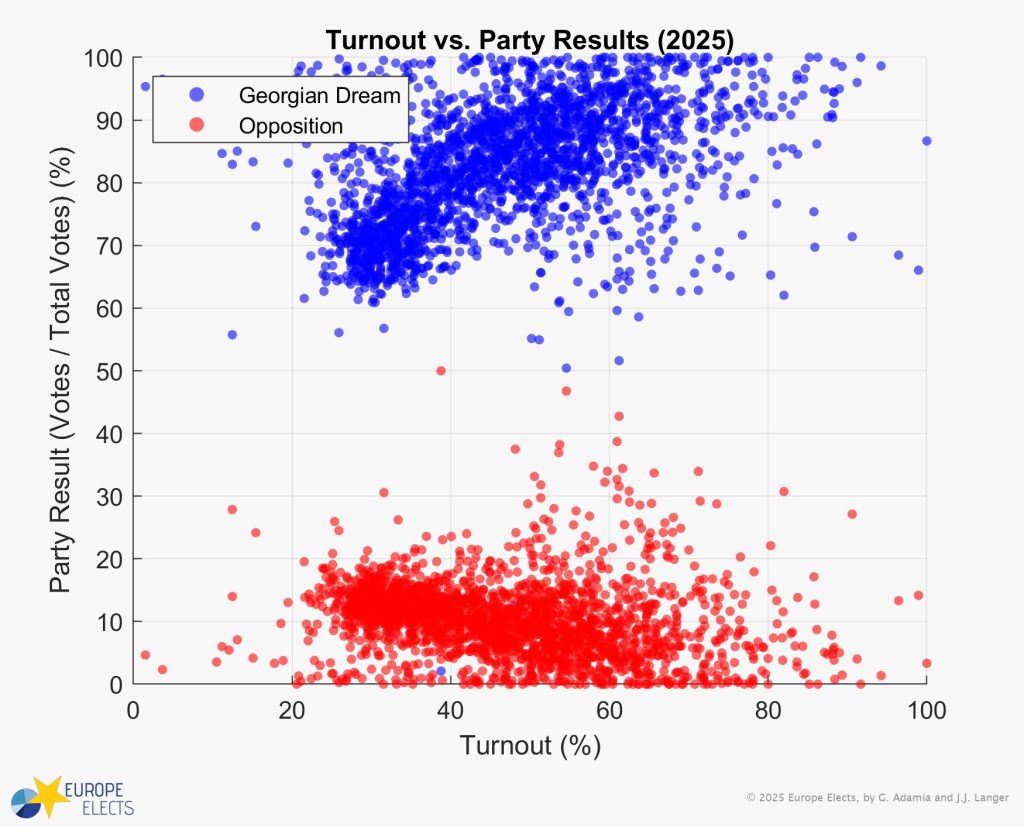
It should be noted that this behaviour may partially be caused by the opposition boycott. Yet, as previously explained, the results of this election do not align with the expected boycott shift.
Additionally, in an election without irregularities, the smaller the precinct is, the more prone to outliers in either direction the turnout and party vote share should statistically be.
Overall, neither parameter should follow a clearly distinct pattern when plotted as a function of precinct size. In the 2021 election, this was indeed the case for urban precincts. In rural areas, smaller precincts tended to have a higher turnout, but even there, the results for GD were independent of the precinct size.
Figure 11: Precinct Size Fingerprint for the 2021 local elections.
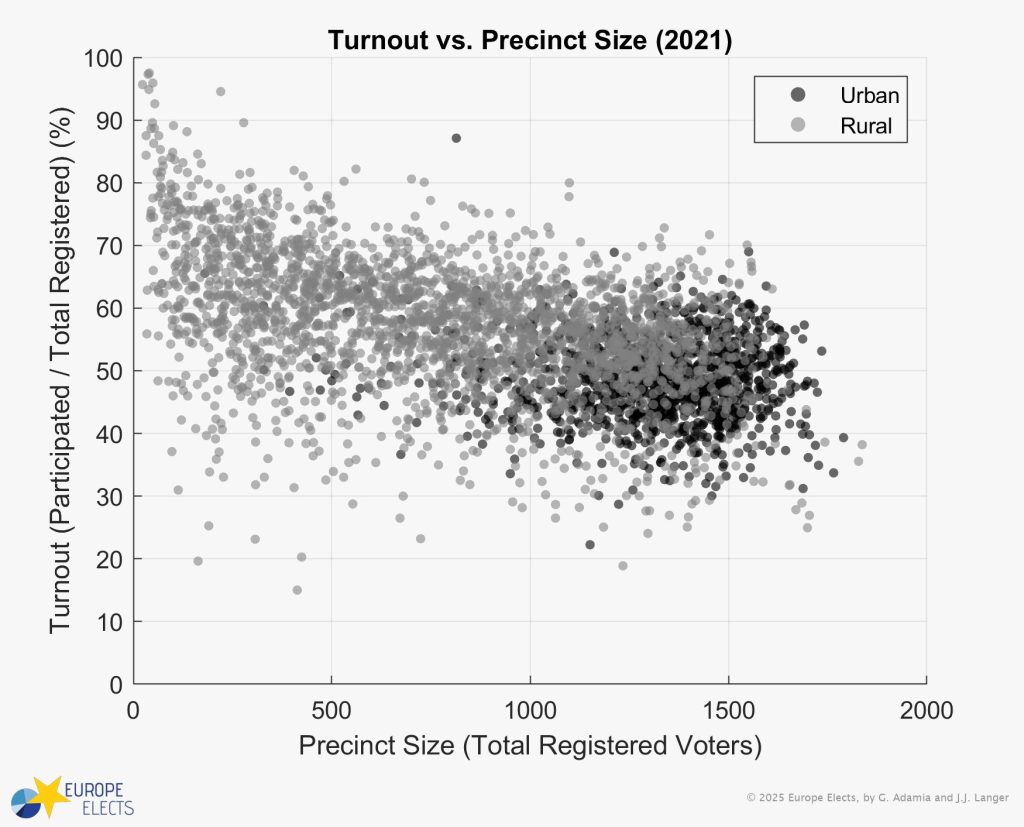
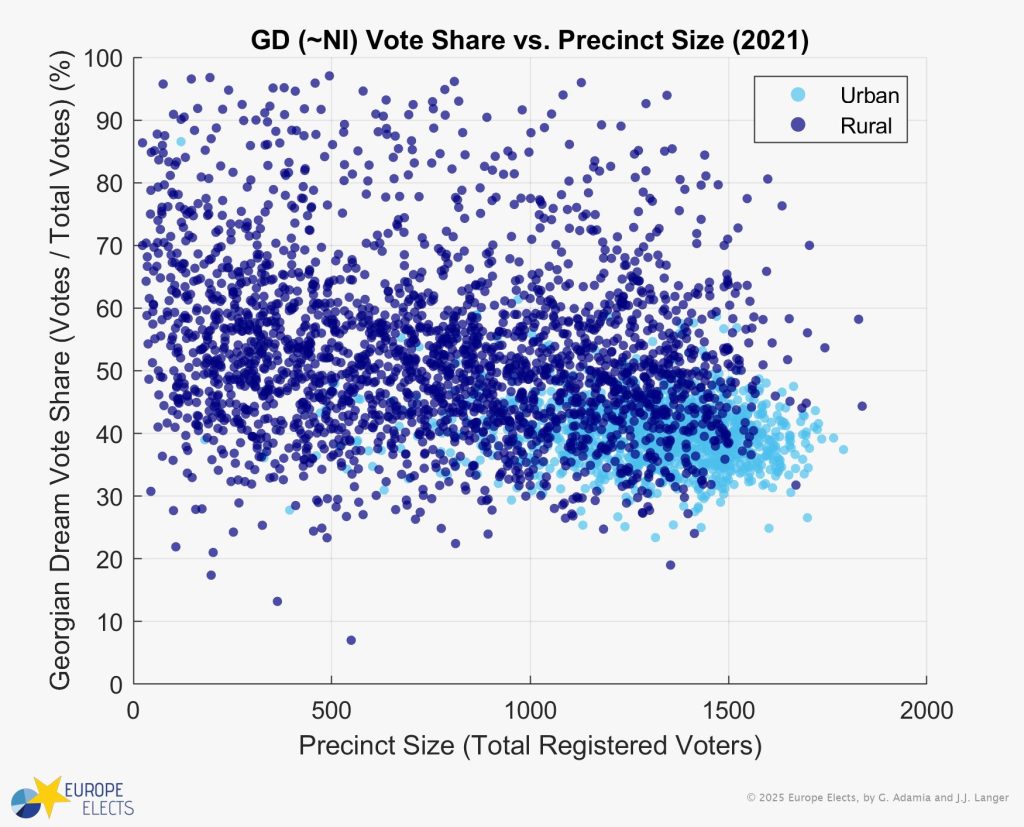
This year, smaller precincts had a much more distinctive pattern. In rural areas, especially, both turnout and GD vote share are inflated, and the turnout-precinct size relationship follows a stronger correlation. Meanwhile, outliers in the opposite direction occurred at a much lower frequency than in 2021.
Figure 12: Precinct Size Fingerprint for the 2025 local elections.
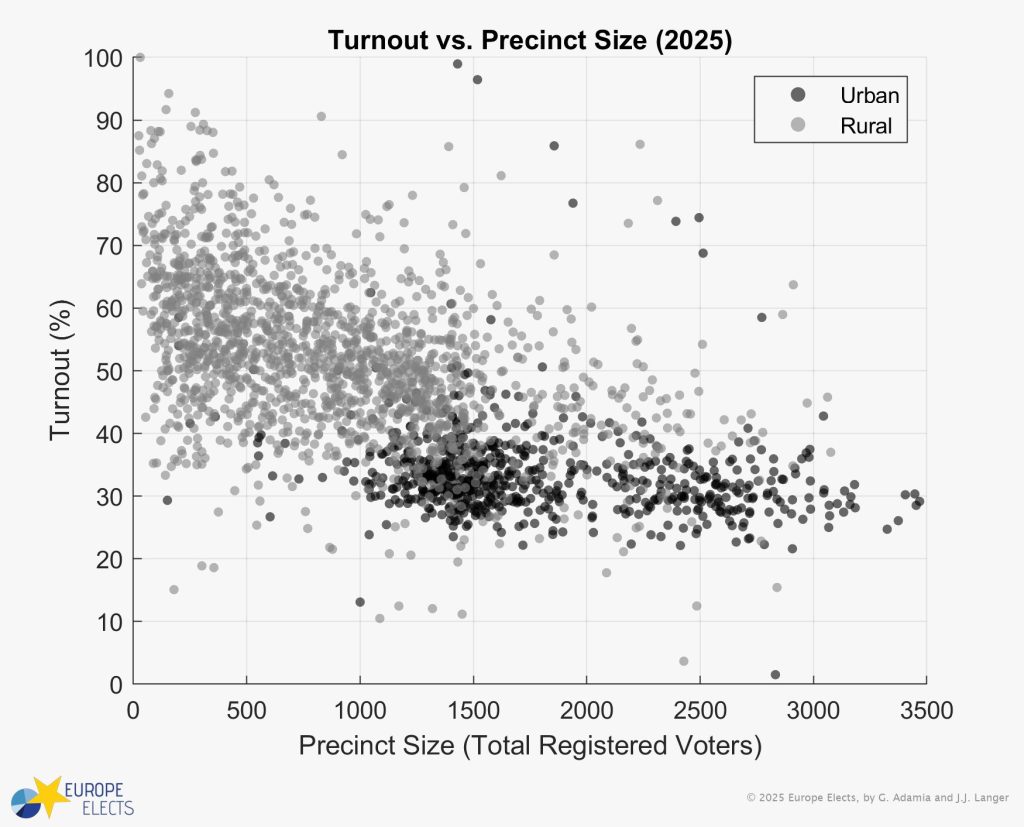
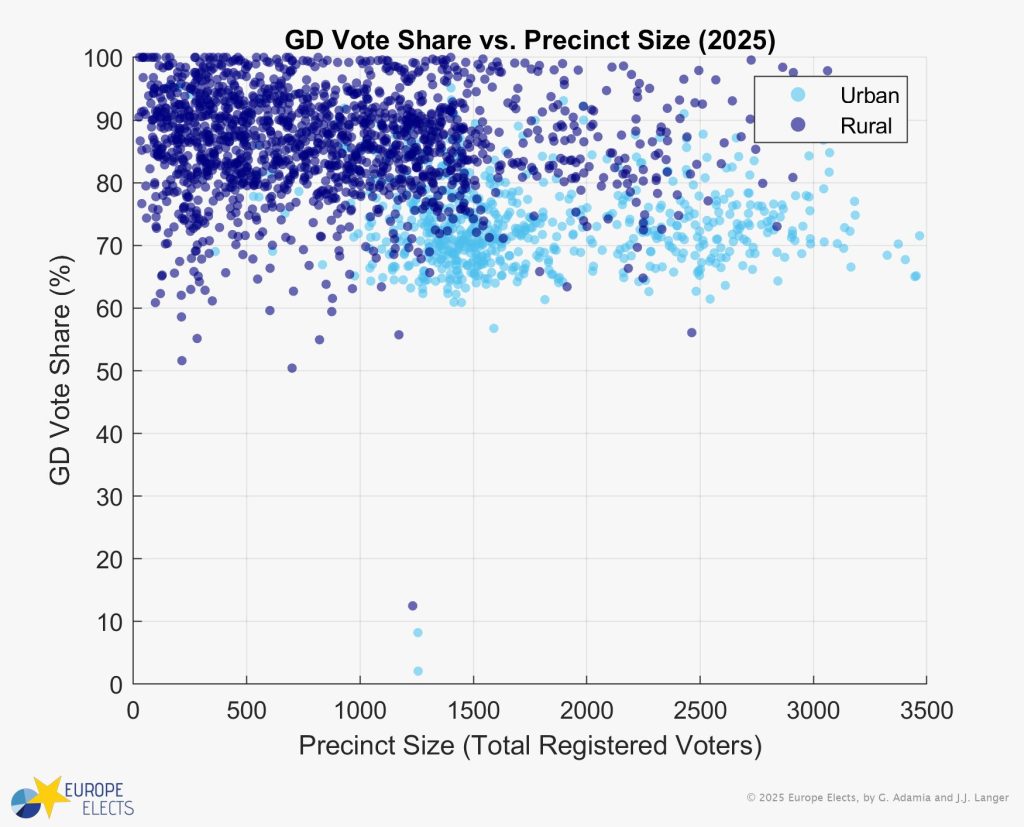
This type of dynamic points towards vote tampering, most likely due to carousel voting or significant pressure on the electorate.
In smaller precincts, applying those tactics has a more noticeable impact and causes a spike at a higher turnout/party vote share: 20 illegitimate votes cast in a precinct encompassing 1,000 voters matters much less than in a 100-voter precinct. And indeed it is rural areas that are more likely to be affected by such forms of vote tampering for various reasons (more social control, fewer observers, a higher share of public servants who would be subject to governmental pressure).
It is noteworthy that from 2021 to 2025, the average precinct size in urban areas has significantly increased, even as Georgia’s voting population within the country decreased due to high emigration.
As fraud-induced outliers are less pronounced in larger precincts, merging voting stations could be a strategy to conceal overly suspicious results in urban areas. This would also align with instances of carousel voting and vote buying in Tbilisi and Batumi, reported by observers.
If such behaviour happened, it would be expected to create tails in the vote share distribution even in urban areas – exactly the type of distribution Europe Elects found.
Conclusion
Deviations from standard electoral patterns are not unusual, but the sheer mass of statistical irregularities in this election (even when accounting for the unique circumstances under which it was conducted) is more than suspicious.
When asked if the numerical anomalies highlighted in his detailed fraud analysis of the 2024 Georgian election (which Europe Elects was able to independently reproduce) could be caused by other factors than falsification, Roman Udot, a data analyst and former political prisoner in Russia, simply said,
“When a drunk person behaves as they do on the street, you can think of a thousand reasons why they behave that way — but in reality, we all know well that they simply drink too much.”
We would like to thank Guram Adamia for his active collaboration and help in creating this article.


